Carbon footprint
A carbon footprint is the total amount of greenhouse gas emissions produced within an organisation's activities. Birkbeck's carbon footprint is reported in line with our financial year (i.e. emissions produced from 1 August to 31 July each year). In line with the Greenhouse Gas Protocol, we identify our emissions according to three ‘scopes’, which are used to group together emissions by sources. We have also reported on some emissions that fall outside of these scopes as they are not within Birkbeck’s control, and on any carbon offsets purchased on behalf of Birkbeck by our providers or staff.
These categories are explained as follows:
Scope 1: sources directly owned or controlled by Birkbeck
This includes:
- Gas burnt in our boilers onsite to heat buildings
- Refrigerant gases used in fridges, freezers, and air conditioning
- For many organisations this would also include fuel used in fleet vehicles; however, Birkbeck does not own any vehicles
Scope 2: purchased electricity and heat that is not generated onsite
This includes:
- Electricity purchased from the national grid
- Heat purchased from the Bloomsbury District Heat Network
Scope 3: emissions that Birkbeck is indirectly responsible for up and down its supply chain
This includes:
- Purchased goods and services from our suppliers
- Business travel
- Waste disposal
- Water
- Commuting (staff and students)
- Working from home (staff)
- Investments
- Fuel and energy related activities, such as electricity lost as it travels through the grid to our sites (transmission and distribution) and the emissions produced by extracting and transporting gas (well to tank)
Out of scope
Emissions that occur from student activities that Birkbeck is not directly or indirectly involved with the operations of. This includes:
- Halls of Residence (Birkbeck does not own or operate any Halls but has 100+ students staying in the University of London’s Halls each year)
- International student journeys (travel by international students to attend Birkbeck, to and from their home countries)
Carbon offsets
A service provided by suppliers or purchased from offsetting organisations to remove carbon from the atmosphere to meet net zero (i.e. balancing our overall emissions produced to zero where emissions cannot be eliminated within our own operations), e.g. via tree planting schemes
Like many organisations, Birkbeck has traditionally focused on its scope 1 and 2 emissions and only reported a small portion of its scope 3 emissions. For 2023-24, Birkbeck worked with workplace performance consultancy LCMB to produce a wider scope 3 carbon footprint to gain a full understanding of its carbon footprint.
All carbon footprint figures are expressed as tonnes of CO2 equivalent (tCO2e). There are various greenhouse gases which produce different amounts of warming, so because carbon dioxide is the most abundant greenhouse gas in the atmosphere, other gases are converted into a ‘carbon dioxide equivalent’. For example, because methane has approximately 25 times the warming effect of carbon dioxide, 1 tonne of methane = 25 tonnes of carbon dioxide. All greenhouse gases produced by an activity are added together and expressed as carbon dioxide equivalent.
All figures in tonnes of CO2e, (Aug-Jul) |
2021-22 |
2022-23 |
2023-24 |
|---|---|---|---|
Scope 1 |
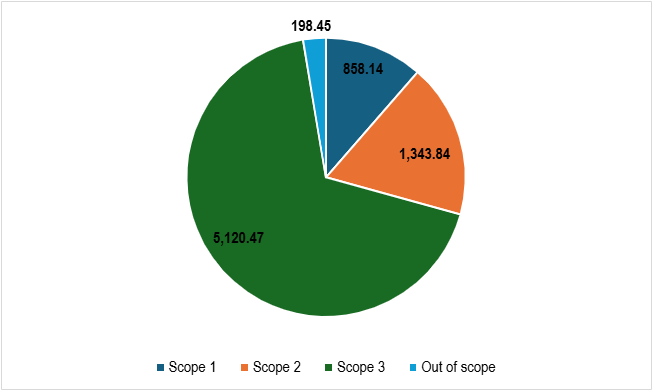
749.40 | 832.81 | 858.14 |
| Gas use | 749.40 | 832.81 | 689.04 |
|
Refrigeration and other gases |
169.10 | ||
Scope 2 |
1,336.00 | 1,455.90 | 1,343.84 |
|
Grid electricity |
1,299.10 | 1,379.90 | 1,233.79 |
|
District heat network |
36.90 | 76.00 | 110.04 |
Scope 3 |
586.33 | 612.97 | 5,120.47 |
|
Suppliers |
2,431.10 | ||
|
Business travel |
877.16 | ||
|
Commuting (staff) |
261.08 | ||
|
Commuting (students) |
374.74 | ||
|
Home working (staff) |
329.76 | ||
|
Water supply |
3.40 | 4.60 | 3.47 |
|
Wastewater treatment |
2.10 | 1.80 | 3.98 |
|
Waste disposal |
2.10 | 2.80 | 0.85 |
|
Well to tank: gas use |
127.67 | 137.40 | 113.81 |
|
WTT: electricity |
304.78 | 321.38 | 273.51 |
|
Transmission and distribution: electricity |
116.58 | 115.48 | 109.05 |
|
WTT for T&D: electricity |
27.88 | 25.58 | 23.66 |
|
Distribution: district heat network |
1.82 | 3.93 | 3.04 |
|
Well to tank: business travel |
104.49 | ||
|
Well to tank: commuting (staff) |
107.79 | ||
|
Well to tank: commuting (students) |
103.00 | ||
Out of scope |
198.45 | ||
|
Halls of residence |
41.29 | ||
|
International student journeys |
139.95 | ||
|
WTT: International student journeys |
17.21 | ||
Carbon offsets |
-4.00 | ||
|
Study link |
-4.00 | ||
Total (tonnes of CO2e) |
2,671.73 | 2,901.68 | 7,516.89 |